It’s one of those things – simple when you know how, but confusing as all heck beforehand!
Yup, we’re talking about reading and understanding your Instagram analytics!
Because we get it – when you first look at all those stats and data and new terms, they seem totally overbearing.
But trust us, spend just a few moments digging deeper, learning what to look for and how to interpret them, and you’ll uncover an amazing world of extremely useful and free data you don’t want to let pass you by!
And so we’ve compiled this concise guide on how to read and understand your Instagram analytics as the first on that journey.
Armed with this info, you can then go on to implement it a hugely beneficial array of ways (here’s our top 3 ways), but more on that later…
Right now, let’s concentrate on learning how to find the data, what it all means and which are the most important bits …
Related Posts
- Why You Need to Watch More Instagram Stories
- 9 Key Ways to Grow on Pinterest this Year
- Everything You Need to Know About the IG Gift Card Sticker
This page contains affiliate links meaning Social Puffin may receive a small commission on any purchases at no extra cost to you.
Instagram Analytics : The Basics
So the first to know when learning to read your Instagram analytics is that there are essentially 3 different places you can go to gather this information.
The first is where you’ll find the overall stats for your whole Instagram account – personally we find this the most useful spot when beginning to analyse a client’s account, as it gives a great overview of how posts and stories are performing, as well as some good data on the account’s audience.
The second place to find Instagram analytics is on each feed post itself. This data is held under the View Insights blue text, which gives a great breakdown about how that particular post has performed.
And the third type of Instagram analytical information can be found within your Stories.
Here’s you can learn about the performance of each Story (bearing in mind it still has to be live) including data on who has seen the story and what actions your audience took in relation to it.
Of course, to access all 3 of these data sources, you must have an Instagram Business Account.
If you don’t have this already, then swap over from your Personal Account for free in just 5 minutes by hitting the relevant button in your profile settings.
Learn more about how to do this here.
How to Find Your Instagram Analytics
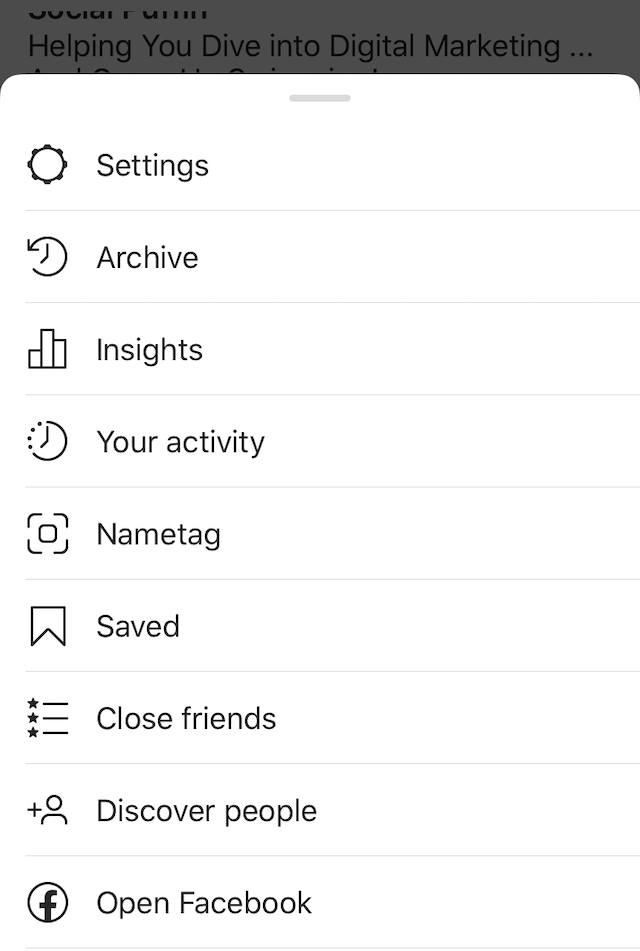
To access analytical data about your whole Instagram account, you need to hit the hamburger button in the top right hand corner of your profile page within the Instagram app.
This should bring you up a menu (as pictured above) where you’ll see an option that reads Insights and has a graph icon next to it. Hit that.
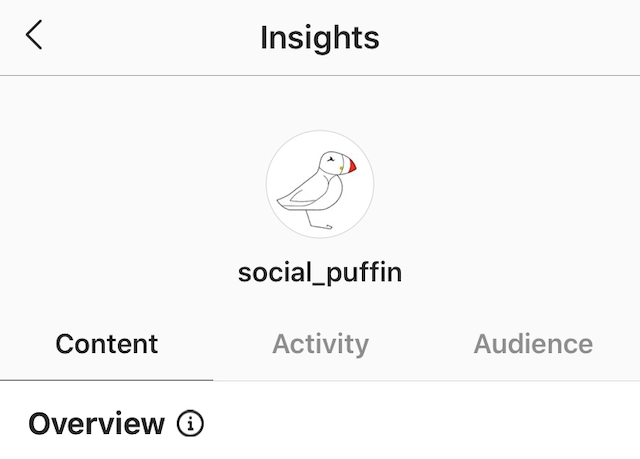
This will reveal information about your whole Instagram account (the data we find most useful initially).
It is handily divided into 3 sections – Content, Activity and Audience – we’ll go into these each in a minute.
Secondly, to get analytical information about each of your Instagram feed posts, then you’ll need to again navigate to your profile page, and hit on the relevant post you want to glean information about.
Below the image, you’ll see the words View Insights in blue font.
Hit this and you’ll get a range of data about how that individual post has performed.
And finally, to access data about your Instagram Stories, you first need to go into your live Stories, by hitting your circular profile icon, which you’ll see at the top of the Home Feed within the Instagram app.
You must have at least one Story currently live to access data this way.
Once in the particular Story you want to glean info on, you’ll then need to tap the area in the bottom left of the screen that shows your audience’s circular profile icons.
Now you are in your Instagram Story analytics.
Here you can toggle between the graph icon and the eye icons (both in the top left of the analytical screen) to get different sorts of data.
More on this to follow…
Overall Account Analytics
As we’ve said earlier, using the overall Instagram account analytics is what we at Social Puffin find most useful in the first instance.
This is because it gives a very useful overview about how both posts and stories on your account are performing generally, as well as your audience and activity.
This data is given under 3 separate headings, which we’ll tackle one-by-one here, so that you can fully understand what they mean and how they work together.
Content
This section talks about your Instagram content – i.e. your Stories and feed posts.
It analyses data over the last week, including how many times you posted and how this compares to the 7 days previously.
You then have a posts section, which gives you a condensed version of stats for each post you’ve published up to 2 years ago.
The posts are not arranged chronologically, but ordered by the best performing post first – depending on the type of data measure selected.
You can amend the date range of the published posts included in the list by hitting the dropdown menu at the top and choosing to show posts published either in the last …
- 7 days
- 30 days
- 3 months
- 6 months
- 1 year
- 2 years
You can also narrow the filter by the type of post you want to view data for – simply select one of the following options from the first dropdown box and choose either …
- Photos
- Videos
- Carousel Posts
- Shopping Posts
And finally, you can choose which types of data are displayed and, consequently, how your posts are ranked here.
There are many different data measures you can select at this point, but in our eyes, the most useful are …
- Reach – How many unique accounts your post was shown to
- Engagement – How times a user liked or commented on your post
- Follows – How many new account follows were received from your post
- Likes – How many likes your post received
- Profile Visits – How many visits to your profile your post resulted in
- Shares – How many times your post was shared
- Website Clicks – How many clicks on your bio link this post led to
- Impressions – The total number of times your post was seen
And finally we come to the Stories section.
Here you can see all the Stories published by your account within the last 14 days.
Again you can amend the date range here and filter your Stories so that they display information according to range of different data points.
Unlike the posts section (as described above), Story analytics are not displayed here with the most successful first.
Instead they are displayed chronically.
The most useful data points for Stories we monitor here at Social Puffin are …
- Reach – How many unique accounts your Story was shown to
- Follows – How many new account follows were received from your Story
- Impressions – The total number of times your Story was seen
- Link Clicks – How many clicks on links contained within the Story were recorded
- Profile Visits – How many visits to your profile the Story resulted in
- Replies – How many audience replies your Story prompted
- Shares – How many times your Story was shared
- Website Clicks – How many clicks on your bio link the Story led to
At the bottom of this Content section, you can also view analytics for any promotions you have run recently.
Activity
This is the very useful second section of your overall Instagram account analytics. It details activity across your account in the last 7 days.
The Discovery section, shows overall how many impressions your content received and what your reach was – in other words, how many times your profile was discovered or seen.
To explain briefly what these terms mean… if your post was seen twice by the same Instagram user you could have an impression score of 2, but a reach record of 1 – because, despite the post having been viewed twice, it only reached one 1 unique account.
If you see spikes in activity across the day-by-day chart this is likely to indicate the days you published feed posts in the last week.
You can also compare how your reach and impressions measure up against the previous 7 days.
The Interactions section below then shows how many profile visits your account received in the last 7 days, how many clicks were made to the link in your bio and how many emails were sent directly using the address in your bio.
Again you can compare how these stats measure up against the previous 7 days.
Audience
And finally we move onto the third and final section of the overall account analytics, which is called Audience.
Here you can see your exact number of followers and how these may have increased or decreased compared to the last 7 days.
In the Growth section, you can chart how your follower numbers tracked daily over the last week and then skip back to the Content section via the See Posts button, to learn exactly which content you published on that particular day.
You can view which cities and towns or which countries most of your audience come from.
You can also see the age bracket and gender percentages your audience break down into.
And finally, you can view which days of the week (and which hours within those days) most of your audience are active on Instagram – this is very helpful for knowing when to post!
Feed Post Analytics

Next we move onto the Instagram analytics found on each published post and discuss what this data means and how to interpret it.
This section is very useful for expanding on the insights gleaned in the Content section of your overall account analytics.
Described by Instagram as Post Insights, we can see for each piece of published feed content the number of likes, comments, shares and saves each post has received.
We can also view the number of profile visits and website clicks (bio link) it resulted in, as well as the reach of the post (2 very useful pieces of data).
You also get a helpful breakdown of how your post reached those people i.e. from the home feed, hashtags, your profile, your location or other.
This can be very useful information if you’re trying to build a solid hashtag strategy.
It’s also worth nothing here the percentage of accounts that saw your post but weren’t already following you.
If you ran this piece of content as a paid ad, then you’ll see the post promotion data below.
Story Analytics

And finally, we move on to understanding your Story analytics within the Instagram app.
These work slightly differently because, as we explained, they are accessed from the home screen and only provide data on any Stories that are still live.
After the 24hr expiry date of the Story, the only place you can view data for this type of content is within the Content section of the overall Instagram analytics.
By hitting the circular audience icons in the bottom left area of each live Story, you can view exactly how many people have seen your story and who they are.
These stats are accessed via the eye button and you the simply scroll to see the accounts.
Next to the eye icon, there is a graph icon.
Hitting this will reveal the number of Interactions taken on your account – i.e. audience replies to that story and the number of visits to your profile page it resulted in.
And below this, you’ll see the Discovery section.
Here you can see how many impressions your Story got (remember this is the total number of times your Story was viewed i.e. not the total number of accounts) and many new followers you gained from the Story.
You can also get data about the audience navigation in relation to each Story i.e. how many people moved backwards or forwards through your Story, as well as how many people skipped to the next Story or exited Instagram Stories altogether.
To be honest, we don’t find these stats very useful, as they can be highly misleading and not give too much accurate information about audience perception.
Perhaps the only useful one we really pay attention to here is Back, which tends to denote that people found your Story interesting or informative and want to hear it / see it again.
Good!
Have you checked out Social Puffin and our Instagram Stories?
Click here to follow us and share the love!
PIN IT TO PINTEREST!
So that’s our overall round up of how to read your Instagram analytics.
We’ve tried to show you where the analytics can be found, how you access them, what they mean and what the most useful points of data are when it comes to tracking your growth and success on the platform.
Hopefully this guide has been simple and informative, but if you still have any questions remaining about Instagram analytics, don’t hesitate to drop them into the comments box below…